How Walkable is Inglewood in Nashville, TN?
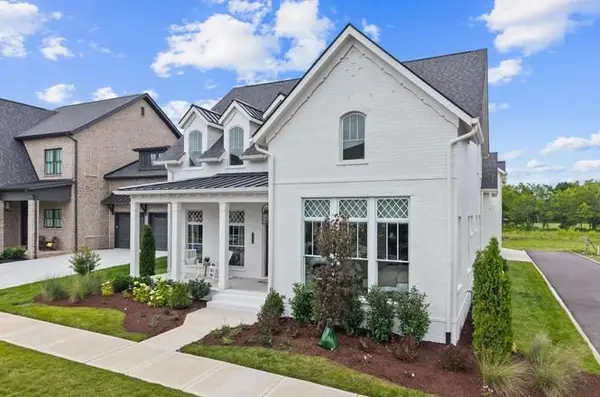
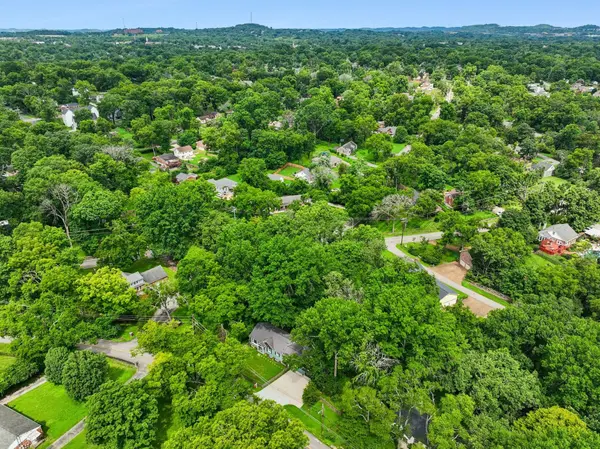
With homes selling faster than nearly anywhere else in Nashville, Inglewood near Nashville, TN pairs strong buyer demand with a modest Walk Score of 35. That puts it in the "Car-Dependent" tier, where most errands require a car. The neighborhood has seen residential growth as buyers seek affordable options close to East Nashville.
Walkability in the Nashville area
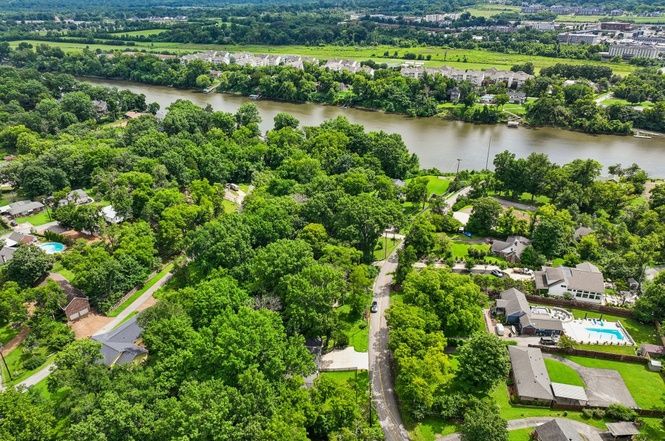
Inglewood's 35 slightly exceeds the Nashville metro average of 29 but trails its East Nashville neighbors. Lockeland Springs (73) and Edgefield (73) are more than twice as walkable, while Charlotte Park (32) and Green Hills (30) score lower.
East Nashville's grid pattern gives some areas reasonable pedestrian access, but Inglewood sits further from the concentrated commercial corridors of Five Points and the Gallatin Pike strip. Bus service along Gallatin Pike provides a transit link to downtown, though frequency is limited.
What a Walk Score of 35 means
Inglewood's Walk Score of 35 means most daily errands require a car. A few restaurants and shops along Gallatin Pike are accessible on foot for nearby residents, but groceries, healthcare, and most services need a short drive. The bike score of 37 (Minimal Bike Infrastructure) and transit score of 33 (Some Transit) indicate limited alternatives to driving.
Why do buyers choose Inglewood?
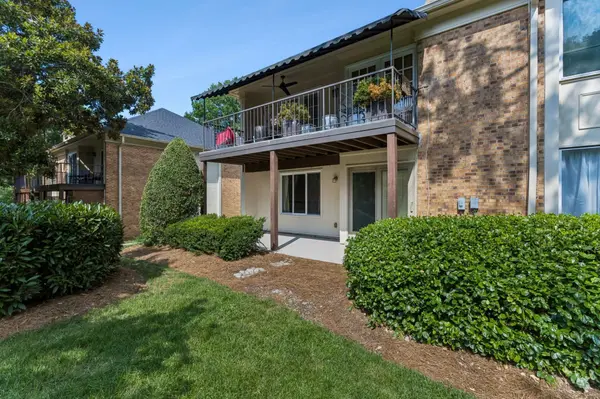
Inglewood delivers East Nashville proximity at a steep discount. The median sale price of $499,729 is well below Lockeland Springs ($810,723) and Eastwood ($719,754), both of which offer double the walkability. About 21% of homes sell above asking and listings go under contract in a median of 43 days—the fastest pace Among Nashville-area Nashville neighborhoods. Over 41% of listings went pending within two weeks, signaling strong competition for the area's relatively affordable housing stock.
The tradeoff is clear: buyers accept lower walkability in exchange for a price point roughly $200,000-$300,000 below the walkable East Nashville neighborhoods. With prices down 20% year over year, the area may be resetting after a period of rapid appreciation.
| City/Neighborhood | Walk Score | Bike Score | Transit Score | Median Price | Days on Market |
|---|---|---|---|---|---|
| Inglewood ★ | 35 | 37 | 33 | $499,729 | 43 days |
| Charlotte Park | 32 | 25 | 25 | $701,760 | 79 days |
| Green Hills | 30 | 30 | 23 | $1,299,556 | 68 days |
| Woodbine | 46 | 31 | 33 | $404,862 | 54 days |
| Shelby Hills | 49 | 44 | 33 | $824,719 | 51 days |
| Salemtown | 50 | 62 | 39 | $764,739 | 64 days |
Limited to neighborhoods with at least 10 home sales in the period.
All data comes from Redfin and represents a three-month rolling average ending July 2026. This article has been generated, in whole or in part, using generative artificial intelligence (AI) technology, with input from Redfin head of economics research Chen Zhao. While efforts have been made to ensure the accuracy and reliability of this information, you should independently verify all data, facts, and citations contained in this article before relying on it for any purpose. This information is not a substitute for advice from a real estate agent, financial advisor, or other licensed professional. Check the Redfin Data Center for additional in-depth housing market data.
Categories
Recent Posts