How Competitive is the Portland, TN Housing Market?
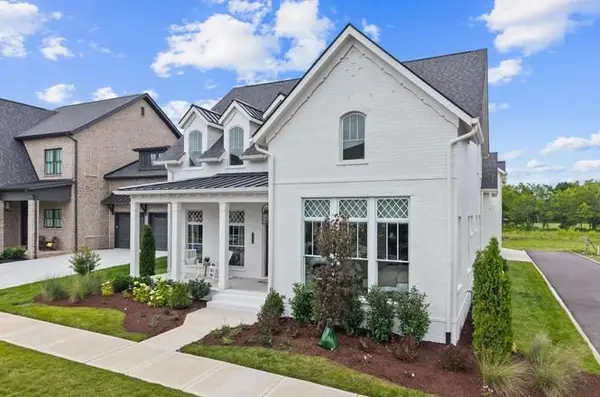
Portland, a city near Nashville, TN, is a moderately competitive housing market. About 17% of homes sold above list price in the 3 months ending June 2026, and the median time on market improved sharply to 58 days—down 12 from a year ago.
The National Picture
Portland's metrics cluster near the national median: its 98.9% sale-to-list ratio tops the national 98.3%, and 58 days on market is close to the national 50. The 16.9% sold-above rate lags the national 24.6%, but the improving speed shows a market gaining momentum rather than losing it.
Gaining Speed While the Metro Slows
Most Nashville-area cities saw days on market rise this period; Portland bucked the trend with a 12-day improvement. Homes sold jumped 41% year over year to 79, and pending sales rose 32%. Compared to Fairvue Plantation in nearby Gallatin (91 days, 0% sold above), Portland's pace and overbid activity are markedly stronger. It's also faster than Donelson-Hermitage (59 days) despite being further from downtown Nashville.
Why is Portland Moderately Competitive?
Portland is moderately competitive because a spike in buyer activity is meeting an expanding supply base that still keeps options open. The surge in sales activity (+41%) signals growing buyer interest—likely driven by Portland's median price of $310,000, well below the metro average. Active listings grew 25% to 194, but demand growth outpaced supply growth, tightening months of supply to 3.7 and keeping price drops at a moderate 31%. Affordability is drawing buyers north, injecting competition into a previously quieter market.
Nearby Neighborhoods
| Neighborhood | Sold Above List | Sale-to-List | Days on Market | Off Market in 2 Wks |
|---|---|---|---|---|
| Portland | 16.9% | 98.9% | 58 days | 28.6% |
| Fairvue Plantation | 0.0% | 97.2% | 91 days | 26.3% |
| Madison | 15.8% | 98.5% | 52 days | 42.2% |
| Donelson-Hermitage-Old Hickory | 16.7% | 98.0% | 59 days | 28.8% |
| East Nashville | 15.8% | 98.1% | 54 days | 37.0% |
| Inglewood | 22.1% | 98.1% | 40 days | 41.8% |
Limited to neighborhoods with at least 10 home sales in the period.
All data comes from Redfin and represents a three-month rolling average ending June 2026. This article has been generated, in whole or in part, using generative artificial intelligence (AI) technology, with input from Redfin head of economics research Chen Zhao. While efforts have been made to ensure the accuracy and reliability of this information, you should independently verify all data, facts, and citations contained in this article before relying on it for any purpose. This information is not a substitute for advice from a real estate agent, financial advisor, or other licensed professional. Check the Redfin Data Center for additional in-depth housing market data.
Categories
Recent Posts